Description
Bug summary
I have created 3D surface plots using matplotlib as described [here]. Everything works except when I set the axis limits. Then the plots look very strange. It appears that commands such as Axes.set_xlim() (whether or not Axes.set_xbound()is used) limit the axis but not the data. The data is plotted and appears to continue beyond the axis limits.
Code for reproduction
axes = []
fig0, ax0 = plt.subplots(subplot_kw={"projection": "3d"})
axes.append(ax0)

surf0 = axes[0].plot_surface(DS_ee, DS_cc, DS_array, cmap=cm.jet, linewidth=0, antialiased=False)

axes[0].xaxis.set_major_locator(MultipleLocator(10))
axes[0].xaxis.set_minor_locator(MultipleLocator(2))
axes[0].yaxis.set_major_locator(MultipleLocator(1))
axes[0].yaxis.set_minor_locator(MultipleLocator(0.2))

axes[0].set_zlabel('Default Spectrum [photons/keV/pixel]', fontsize=7)
axes[0].set_xlim(left=0, right=10)
axes[0].set_zlim(0, 3000)
# axes[0].set_xbound(0, 10)
# axes[0].set_zbound(0, 3000)

for t in axes[0].xaxis.get_major_ticks(): t.label.set_fontsize(6)
for t in axes[0].yaxis.get_major_ticks(): t.label.set_fontsize(6)
for t in axes[0].zaxis.get_major_ticks(): t.label.set_fontsize(6)

axes[0].grid(False)
axes[0].view_init(elev=elev_angle, azim=azim_angle)
axes[0].set(xlabel='E [keV]', ylabel=ylabel)
Actual outcome
Surface plot after using Axes.set_xlim(left=0, right=10):
Surface plot after using using Axes.set_xlim(left=0, right=10) and axes[0].set_zlim(0, 3000):
Expected outcome
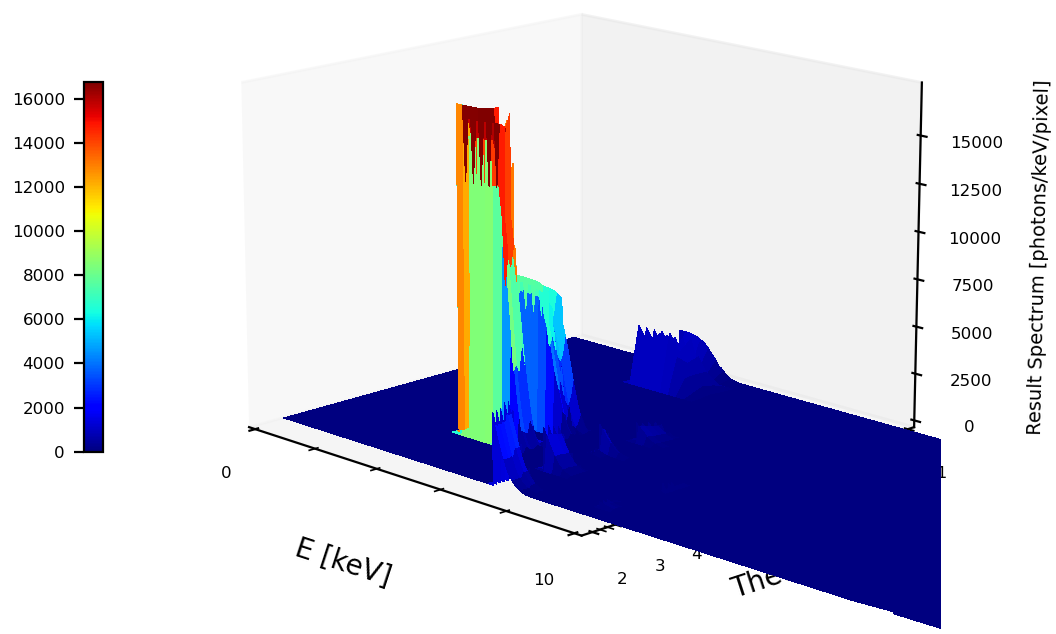
The image should look like the following but with the E axis ending at 10 keV and the vertical axis ending at 3000:
Additional information
I'm running the code that imports matplotlib in Spyder. I can share upon request the full code and input files needed to reproduce the error.
I tried all the suggestions in this post and also this one and none worked. For example, I tried:
axes[0].set_xlim(left=0, right=10)
axes[0].set_zlim(0, 3000)
Also
axes[0].set_xlim(min=0, max=10)
axes[0].set_zlim(0, 3000)
and
axes[0].set_xlim(left=0, right=10)
axes[0].set_zlim(0, 3000)
axes[0].set_xbound(0, 10)
axes[0].set_zbound(0, 3000)
and
axes[0].set_xlim3d(left=0, right=10)
axes[0].set_zlim3d(0, 3000)
Operating system
OS/X Ventura 13.3.1
Matplotlib Version
3.5.2
Matplotlib Backend
Qt5Agg
Python version
3.9.13
Jupyter version
No response
Installation
None


